I’ve been revisiting the evidence of the early spread of the virus in 2019 and the first confirmed cases and I’ve arrived at what I think is the most likely course of events for how the virus emerged.
To cut a long(ish) story short, it looks like the virus was spreading globally by the second half of November 2019. The bit that was hard to understand was why, if it was in countries all around the world that winter, the explosive outbreaks only began in February and March 2020.
Looking again at the reports of the emergence of the virus in close detail, it appears that this is because the virus’s journey from first emergence in autumn 2019 to explosive outbreaks in early 2020 occurred in a slower and more staggered way than we might expect from a simple understanding of viruses. This is not because the virus wasn’t present in countries prior to causing explosive outbreaks there – that’s the simplistic assumption that is contradicted by the data – but because the virus doesn’t always cause explosive outbreaks when it is present.
The novel SARS-like virus seems to have first started infecting humans around the end of October 2019. This was very likely in Wuhan. It might be suggested that if the virus was spreading globally in November 2019 then it could have started anywhere and the fact that it was first detected in Wuhan implies nothing about where it started.
However, it does appear that the December outbreak in Wuhan where it was first detected was the largest to that date. In addition, the following month Wuhan was the first place to experience an explosive outbreak that taxed the health services, some weeks before anywhere else. The fact that it was ahead of the curve in these larger outbreaks is a strong indicator that the virus had been there longest and originally emerged there.
Molecular clock studies, which analyse the genetic make-up of early cases to calculate when their most recent common ancestor was around, tend to put the virus’s emergence in late October or early November, which is consistent with global spread towards the end of November.
In China, a leaked Government report on early cases in Wuhan identified nine patients hospitalised in November 2019 with what was later confirmed as COVID-19 (the earliest symptom onset date was November 17th), though these have never been added to the official total. A study also claimed to find no neutralising antibodies in Wuhan blood donors in September to December 2019, though it’s unclear how reliable this is.
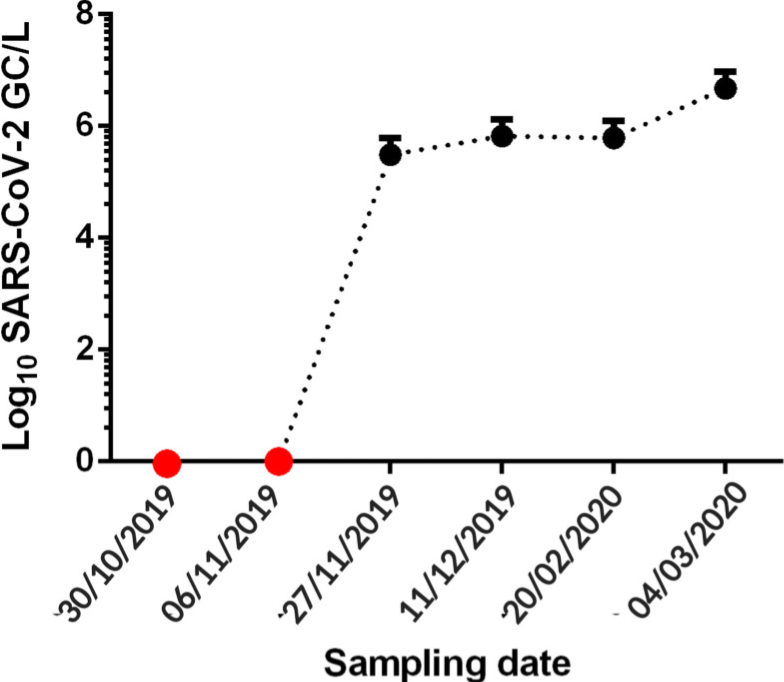
In Brazil, banked wastewater samples turned positive as of November 27th 2019, indicating significant community spread of SARS-CoV-2 at the end of the month. Interestingly, samples from Italy in a separate study didn’t turn positive until December 18th. No wastewater positives have turned up earlier than this anywhere (save for an anomalous positive for Barcelona in March 2019 that is widely believed to be a false positive).

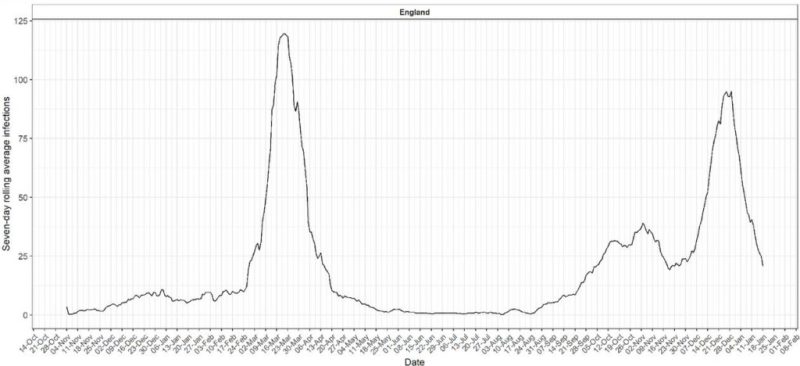
In England, Imperial’s REACT study tested around 150,000 people for antibodies in early 2021 and asked those who tested positive when they recalled having symptoms. This resulted in the following graph.

A notable rise in symptomatic illness can be seen from the end of November 2019 to a steady level that continues through the winter. The explosive outbreak of the first wave in late February 2020 is also clearly visible. This graph neatly illustrates how the virus can circulate for months at a low level (three months in this case), including through the winter flu season, before an explosive outbreak occurs, apparently out of the blue.
We don’t have good data from the United States on early spread as the country has consistently failed to undertake studies on stored samples of wastewater or from individuals, save for one Red Cross antibody study that found antibodies in mid-December 2019 but did not look at earlier samples or confirm with testing for viral RNA.
Nonetheless, there has been no shortage of news reports from the US that have told the stories of several individuals who became ill with Covid-like illness in November 2019 and later tested positive for Covid antibodies (when they had not been ill in the interim).
These individuals include Michael Melham of New Jersey, who reports being infected along with several others at a conference around November 21st 2019; Uf Tukel, who reports being infected in Florida along with 10 others in late November 2019; Stephen Taylor and his wife, infected in Texas in November 2019; and Jim Rust, infected in Nebraska the same month. Bill Rice, Jr. has collected together the media stories of these early antibody-confirmed US cases. It is notable that none of them claim to have been infected before November.
This evidence of late November spread in China, Brazil, England, and America is, I think, highly persuasive; even if one or two of the cases turn out to be mistaken, I do not think it likely that all of them will be. They are also consistent with the estimates of the aforementioned molecular clock studies.
This evidence suggests that the virus was not spreading globally much earlier than this. This is based on the negatives in the wastewater studies, the negligible levels in the Imperial study, the lack of Americans reporting illness, and the absence of patients in China. The studies which appear to show earlier global spread than this may be due to cross-reaction of antibodies or contamination of the high-magnification PCR testing.
This allows us to conclude that the virus was spreading at a low level around the world by late November 2019, but probably not much earlier than this. What happened next?
The outbreak in the Huanan market appears to have begun around December 1st – this was the earliest symptom onset date in the first cluster of confirmed Covid patients, who began to be admitted to hospital on December 16th. This outbreak appears to have been significantly larger than other outbreaks up to that point. By January 2nd, 41 patients had been confirmed as admitted to hospital with a positive Covid test along with pneumonia and a characteristic chest CT scan; six of them later died.
It was this cluster of hospitalisations that led to the detection of the virus, as at least nine samples from these patients were sent by clinicians for genomic analysis between December 24th and December 31st 2019. The detection of the virus in the wet market outbreak therefore appears to have been a direct consequence of the severity of that outbreak – it caused significantly more hospitalisations than other outbreaks up to then and prompted a number of clinicians independently to send samples for identification. This made it basically inevitable it would be detected during this outbreak.
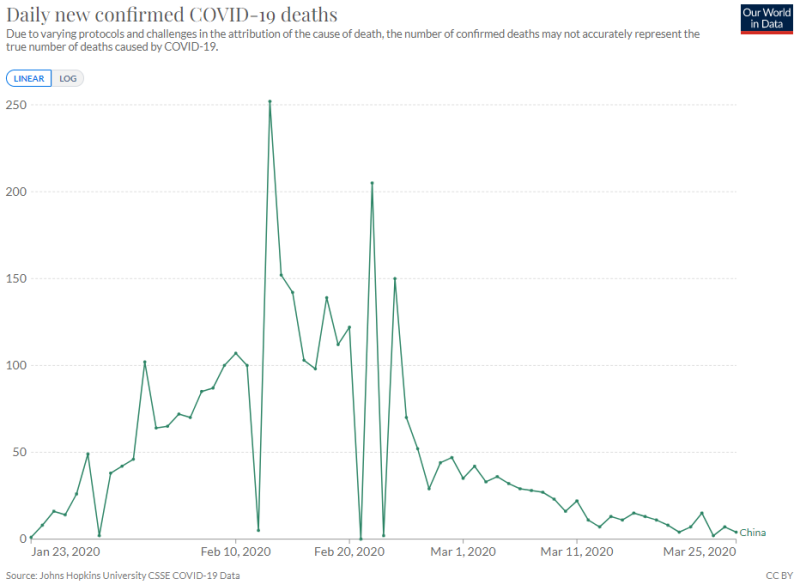
That said, the outbreak was very small compared to most of the waves we’ve seen since 2020, and indeed compared to what happened in China the following month. Looking at the curve of reported Covid deaths for China in 2020 indicates that the explosive outbreak in the region didn’t really begin until the first days of January (by counting back around 20 days).

This may explain why there was initial uncertainty about whether there was human-to-human transmission, while by January 14th it was becoming increasingly obvious that there was as they were in the middle of an explosive surge for the first time. It was also likely the recognition of this explosive outbreak that prompted the Chinese authorities to impose restrictions on Wuhan from January 23rd.
Oddly, the explosive January outbreak in Hubei province was not replicated in other parts of China, which were largely left untroubled by the virus at this point. Instead, the next place to see an explosive outbreak was South Korea, over a month later in February, and once again it was oddly limited largely to one city, Daegu. It was on a similar scale to the Wuhan outbreak with a similar number of deaths.
Next it was the turn of Italy and Iran to experience explosive outbreaks, beginning in mid-February. The outbreak in Italy was still mainly restricted to one part of the country, though the scale of it was beyond anything yet seen, and the Iranian outbreak was of a similar magnitude. Then followed New York and the north eastern United States, and also England, France and much of Western Europe (though not Eastern Europe or much of the rest of the US). All these outbreaks were much closer to the larger Italian scale than the Chinese and South Korean scale. Other places continued with low level spread until they had their first explosive waves later in 2020, or in some cases in 2021 or even 2022.
What strikes me about this is how the size and scope of the outbreaks increased stepwise between November 2019 and February 2020. Spread in November 2019 was global but low level. In December, the Wuhan wet market outbreak took things up a notch, resulting in a higher number of hospitalisations and thus detection of the virus. Then in January, Wuhan experienced the first explosive Covid outbreak and wave of deaths. And in February the large European and American waves began, ramping up the scale another several notches, where it largely remained. (Omicron, when it came along in late 2021, boosted the size of outbreaks even further but considerably cut the death rate.)
This provides, I believe, an accurate picture of how the virus emerged – via a stepwise move towards larger and larger outbreaks from an inauspicious start of low level spread in November. This movement is, I presume, a result of genetic changes in the virus, which alter its transmissibility in different populations and contexts – a hypothesis which is in line with the conclusions of molecular clock studies.
We can therefore, I think, be reasonably confident the virus first emerged in Wuhan during autumn 2019 and wasn’t just first detected there, as Wuhan was first to experience the larger outbreaks in both December and January, which suggests the virus had been there the longest.
Infowars Was Right Again COVID Admittedly Leaked from Wuhan Lab
Source: News Wars Rephrased By: InfoArmed
